Salary by State
| 193 | Pieces of Coverage |
| 2,084 | Social Shares |
| 85,000 | Visits |
The things people talk about
Rasmussen College is a career-focused college in America, and they wanted to create content to help people when they were considering changing career.
We had created a couple of successful interactive campaigns for them before, including a Career Aptitude Test and a data-driven story called ‘What Career Should I Choose?’
Now it was time for the next campaign.
One of the things people consider when choosing careers is, of course, salary.
When I started exploring the topic of salaries, I was reminded of several conversations I’d had with friends.
Having recently moved to London, I often ended up speaking to people back home (in Scotland) about the cost of living in this city. And at some point, someone would usually say ‘Yeah, but you get the salary to make up for it, right?’
But this made me wonder…
Do we we really though?
Are London salaries really that much higher?
Enough to cover the increased cost of living?
I had previously thought about creating a campaign showing the average salary versus the cost of living in different locations around the UK. But the data we needed wasn’t available.
But when we were working with Rasmussen, the career-focused college, the idea resurfaced, and found a new home.
And this time, thanks to the Bureau of Labor Statistics in America, the data was available.
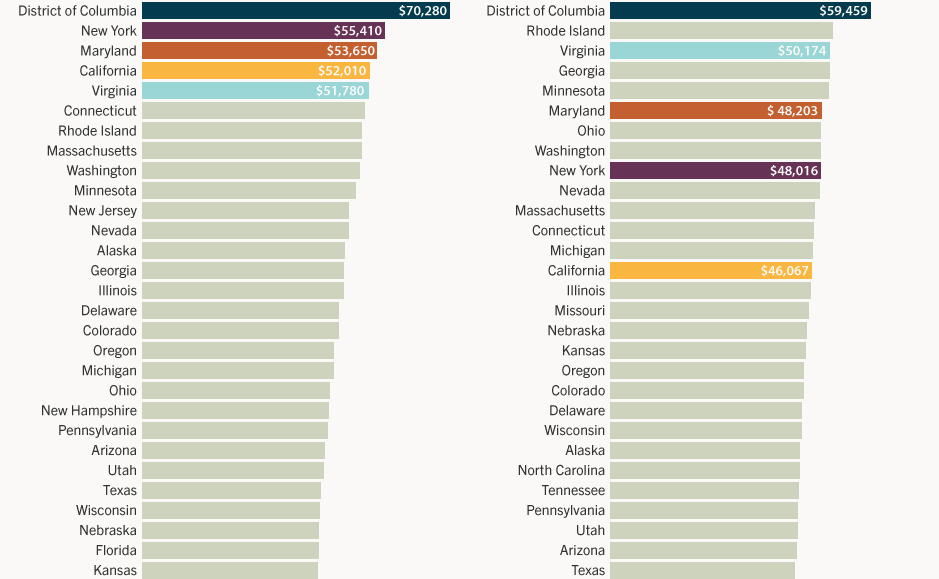
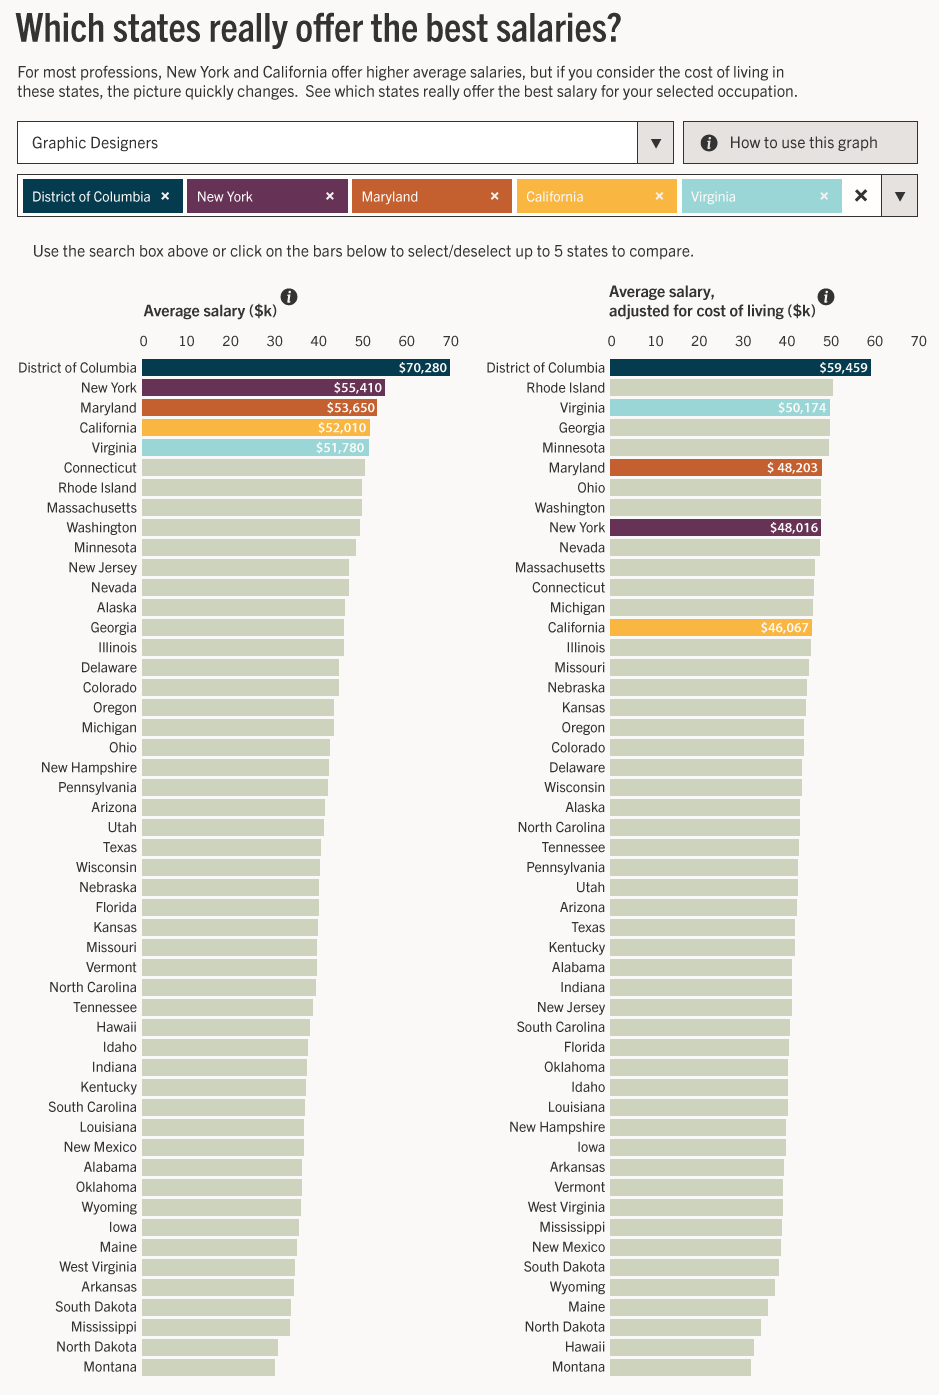
This allowed us to show, for example, that for graphic designers… New York was the 2nd highest state by average annual salary, but it falls to 9th position when you take the cost of living into account.
In the other direction, Rhode Island jumps from 7th place to 2nd, and Georgia leaps from 14th to 4th.
The interactive graphic allowed people to search for different professions and see where people really got paid the most.
“Rasmussen College, which gave us two excellent career-finding tools, is back with this interactive salary by state chart”
Lifehacker