The Careers of Authors
| 101 | Pieces of Coverage |
| 4,734 | Social Shares |
| 208,000 | Visits |
What’s the point?
We were working with a site that sells eBooks, and the original idea was to ‘Visualise the Careers of Authors.’
But there’s actually a problem with ideas like that.
They might sound good on the surface, but if you look closely, all we’re really saying is ‘Here’s a topic that we’re going to visualise’. But what exactly do we want to reveal?
What specific variable will we focus on?
To prevent ourselves falling into this trap, I’ve developed a process to make sure we ask ourselves the right questions up front, to make our thinking more precise. For this particular challenge, the question to ask is:
“What’s the one thing this shows?”
Now, it might contain more than one thing, but if it only showed one thing, and people only took one thing away from it, what would that be?
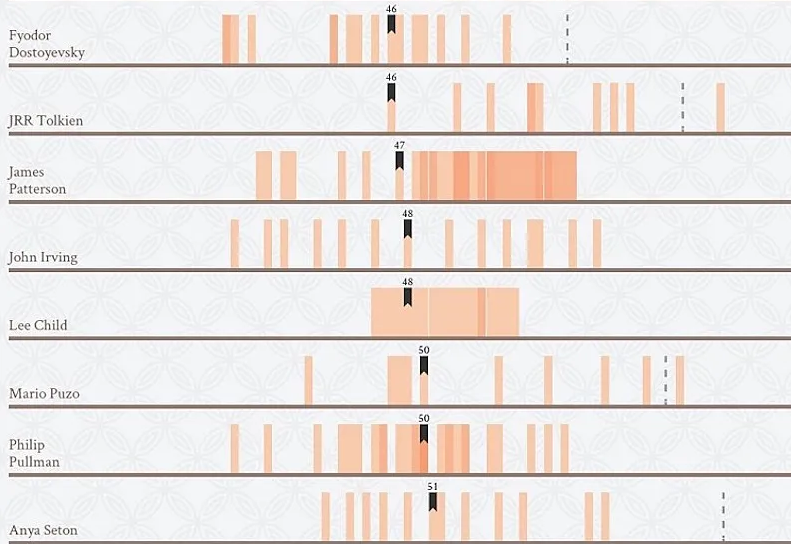
Originally, we wanted to focus on the most productive writers, showing which authors published the most books each year. This was inspired by seeing a new bestseller from certain authors, like James Patterson, every time I went through the airport.
Seriously, how many books has this guy written?!
However, during production phase, my colleague Hannah convinced me the more compelling angle was to focus on the age at which famous authors wrote their breakthrough book, either a critically acclaimed classic or commercial bestseller.
The client’s business was popular among readers of popular fiction, but they wanted to get in front of a more literary crowd, many of whom harboured ambitions to write a book themselves one day.
And this campaign allowed us to deliver an encouraging message.
“This chart proves it’s never too late to publish a novel”
Vox
Funnily enough, shortly after we released this content, Hannah went on sabbatical – to focus on writing.