Salary by State
| 193 | Pieces of Coverage |
| 2,084 | Social Shares |
| 85,000 | Visits |

The things people talk about
I like to pay attention to the things people talk about, and often think about whether we could show it with data.
On a number of occasions, I’ve been involved in conversations about the cost of living in London, where I’ve lived for the past 17 years. And often, someone who doesn’t live there will say, ‘Yeah, but you get the salary to make up for it, right?’
Do we we though?
Are London salaries really that much higher?
I wanted to create a piece of content that showed the average salary in different cities versus the cost of living in those locations.
However, the data we needed wasn’t available for the UK. But when we were working for a career-focused college in America, the idea resurfaced, and found a new home.
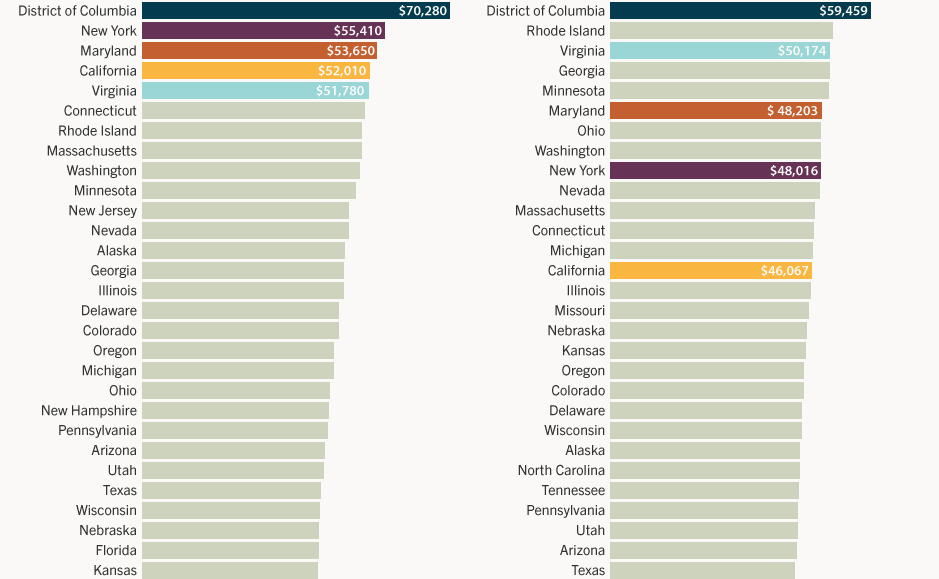
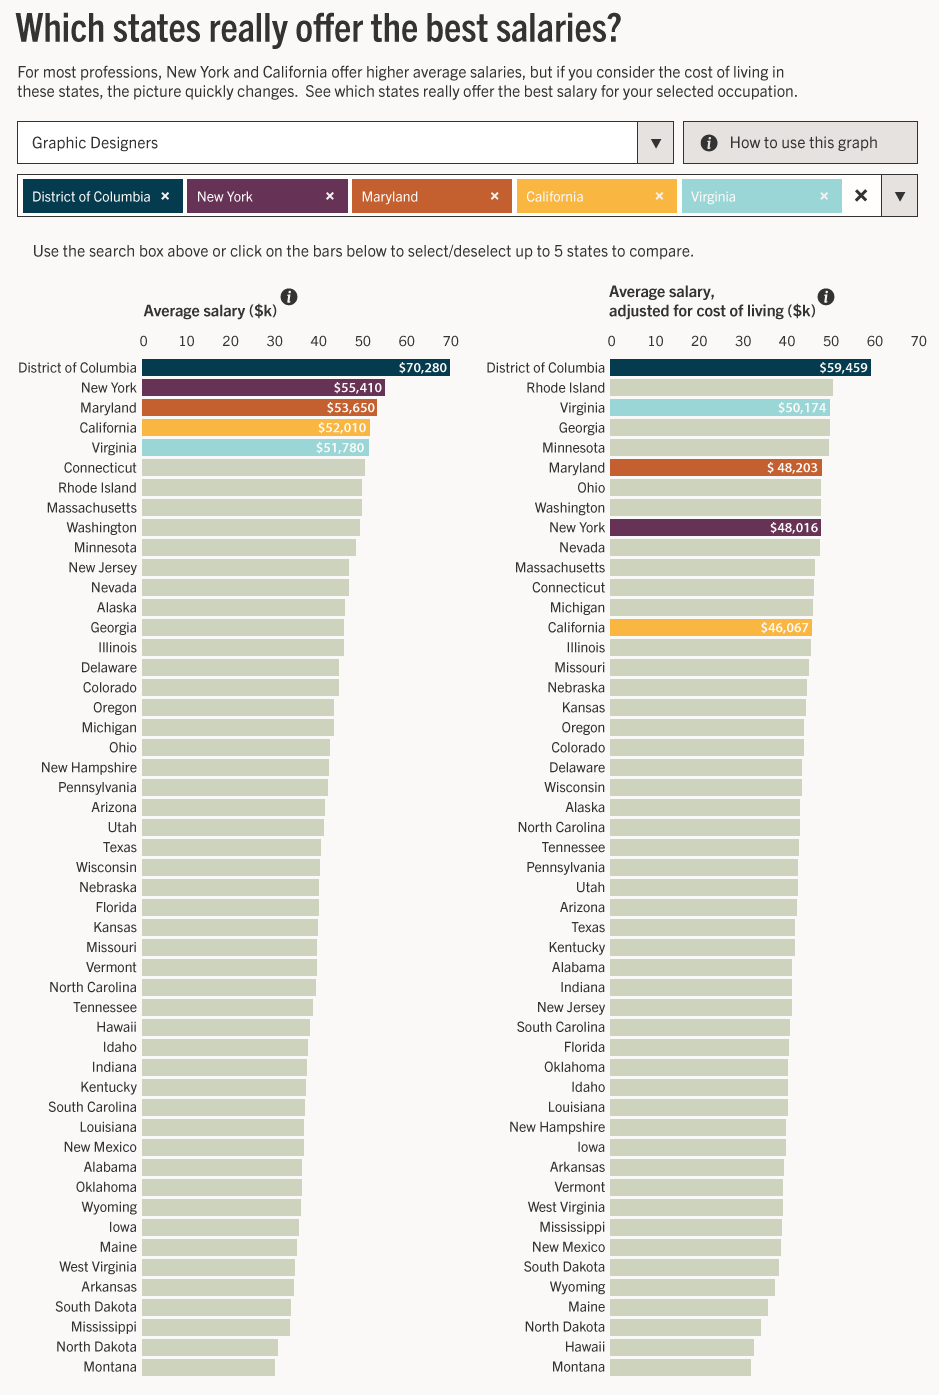
We were able to show, for example, that for graphic designers, New York was the 2nd highest state by average salary, but falls to 9th when you consider the cost of living.
In the other direction, Rhode Island jumps from 7th place to 2nd, and Georgia leaps from 14th to 4th place.
The interactive graphic allowed people to search for different professions and see where people really got paid the most.

“Rasmussen College, which gave us two excellent career-finding tools [we made those too], is back with this interactive salary by state chart”
Lifehacker
